
Promotional merchandise inventory carrying cost is the cost of holding leftover stock, and most swag budgets leave it out. It combines storage, handling, insurance, cost of capital, shrinkage, aging, and the expected loss if a rebrand makes stock unusable, and it is built from your own inputs rather than a benchmark rate. In the illustrative example below, holding 5,000 units for a year adds about 19% to the purchase price. This guide is written for marketing procurement leads in US and UK markets buying branded merchandise that will be stored before use, who can obtain storage and handling quotes and estimate a rebrand date. Assumptions are dated October 15, 2026.
Budget scrutiny makes this a current priority: a large order can win on unit price and still lose once the cost of holding it is counted, and that cost arrives after the purchase order is approved, in lines that belong to other budgets. The sections below provide a decision table for where to hold stock, a component table and formula, a buyer framework with a named decision owner, a worked example with a rebrand-risk sensitivity test, and a comparison of one large order against two smaller ones.

Why Most Swag Budgets Forget Carrying Cost
The purchase order shows the price of the goods. It does not show what happens to the goods that are not used straight away. Storage, handling, insurance, and the cost of tied-up cash usually sit in operations or finance, shrinkage appears as a stock count difference months later, and the loss from a rebrand is recorded as a write-off, not as a cost of the original decision.

Promotional merchandise inventory carrying cost pulls those scattered lines back into the buying decision. It is the import-side landed cost’s counterpart on the holding side: landed cost ends when the goods reach your dock, and carrying cost begins there and runs until the last unit is used, given away, or written off.
Decision Table: Where to Hold the Stock
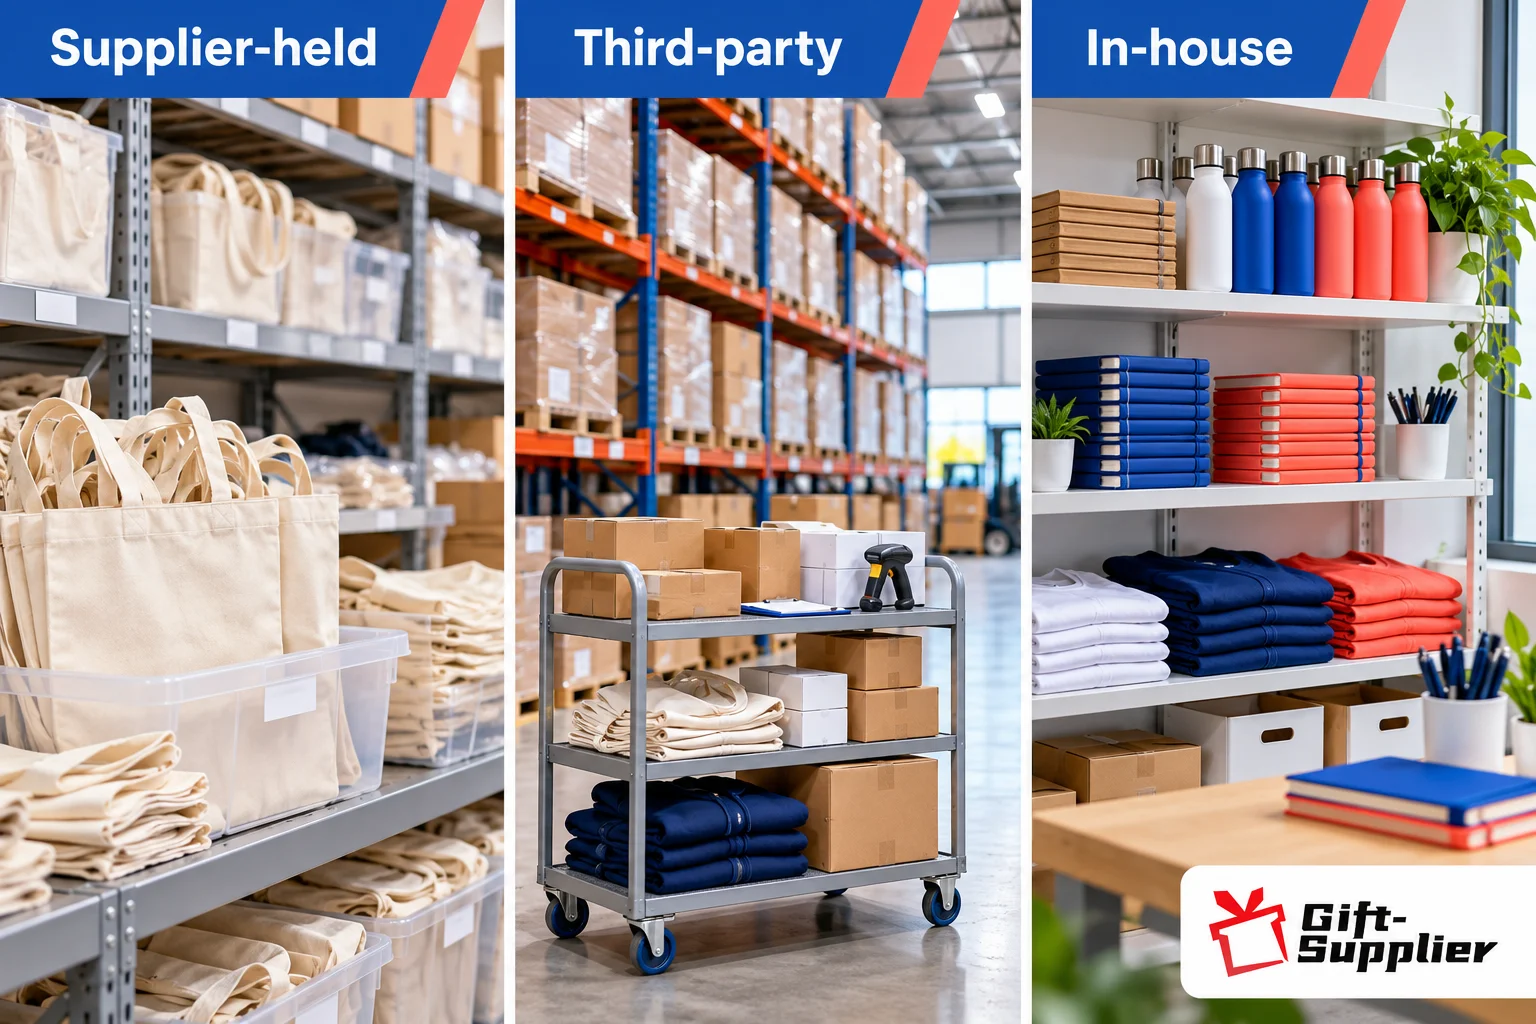
How stock is held changes which carrying cost lines apply. The table compares three common options against criteria you can verify. Terms vary by supplier and provider, so treat each cell as a question to confirm.
| Criterion | Supplier-held stock (call-off) | Third-party warehouse | In-house storage | What to verify |
| Storage and handling charges | May be bundled or quoted per carton per month, sometimes with minimums | Rate card covering storage, receiving, and pick and pack | Mostly space and labor, often untracked | An itemized rate card and any minimum charges |
| Shrinkage and damage control | Depends on the supplier’s controls and who bears loss | Stock counts and loss terms set in the contract | Depends on your own controls | Who bears loss, and how often stock is counted |
| Flexibility if branding changes | May allow undecorated stock to be held and decorated on call-off, if offered | Holds finished goods, so decorated stock is fixed | Holds finished goods, so decorated stock is fixed | Whether blanks can be held undecorated, and the decoration setup cost on call-off |
| Lead time to recipients | Depends on call-off and decoration lead time | Often shorter for finished stock already on hand | Immediate locally, otherwise your own fulfillment | Lead time at your quantity and recipient locations |
| MOQ and commitment | May require a blanket order or committed quantity | Commitment is the stock already bought, plus any minimum storage term | No commitment beyond the purchase | Committed quantity, term, and any minimum storage period |
| Stock visibility | Depends on the reporting offered | May provide inventory reporting | Your own count process | Reporting frequency and access to live counts |
The Carrying Cost Components and Formula
Seven components make up the cost. Storage and handling are physical costs, charged per carton or per unit. The other five are risk and capital costs, expressed as a rate applied to the average value of inventory held. Each needs an input from your own team or provider.
| Component | How to quantify | Illustrative input | Evidence to request |
| Storage | Average cartons held × rate per carton per month × months | $1.50 per carton per month | Warehouse or supplier quote with minimum charges |
| Handling | Units moved × cost per receive, pick, and pack | $0.15 per unit | Handling rate card, including receiving and returns |
| Insurance | Average inventory value × cover rate | 0.5% per year | Insurance quote or policy extension |
| Cost of capital | Average inventory value × finance team’s rate | 8% per year | Finance assumption, dated |
| Shrinkage | Average inventory value × loss rate from stock counts | 3% per year | Past stock counts and damage records |
| Aging | Average inventory value × expected rate of units becoming unusable with age | 2% per year | Product condition guidance and past write-offs |
| Rebranding loss | Average inventory value × probability of rebrand × (1 − salvage recovery) | 10% probability, 20% salvage | Brand roadmap dates and salvage options such as reuse or donation |
| Carrying cost = Storage + Handling + Average inventory value × (Cost of capital + Insurance + Shrinkage + Aging + Rebranding loss rate), where Rebranding loss rate = Probability of rebrand × (1 − Salvage recovery). All-in cost per unit = (Purchase cost + Carrying cost) ÷ Units ordered |
Average inventory value assumes stock is used at an even pace, so that on average you hold half the purchase value over the holding period. If usage is front-loaded or back-loaded, use your own usage plan to estimate the average.
Buyer Framework: How to Quantify Carrying Cost Before You Order
The steps below turn the formula into a repeatable process. The decision owner is typically the marketing procurement lead, with finance supplying the cost of capital and warehouse or supplier operations supplying storage and handling rates.
- Estimate the holding period and usage pattern from your program calendar, and derive the average inventory held.
- Request storage and handling rate cards, including minimums and receiving fees, from each place you could hold the stock.
- Ask finance for the cost of capital and insurance rate, and record both with dates.
- Estimate shrinkage and aging rates from past stock counts and write-offs, and use a range where history is thin.
- Get the brand roadmap dates, estimate the probability of a rebrand within the holding period, and set a salvage assumption.
- Calculate carrying cost and all-in cost per unit, then run the rebrand-risk sensitivity and compare against a smaller-order alternative.
- Record the inputs and dates, and compare the estimate with actual stock counts and write-offs after the program.

Evidence From the Field: Illustrative Worked Example
A marketing procurement lead at a mid-market consumer brand orders 5,000 units of a branded item at a landed cost of $4.00 per unit, a purchase cost of $20,000. The units come in 100 cartons of 50 and are used at an even pace over 12 months, so the average stock held is 2,500 units, worth $10,000, or 50 cartons.
| Carrying cost line | Calculation | Illustrative cost |
| Storage | 50 average cartons × $1.50 × 12 months | $900 |
| Handling | 5,000 units × $0.15 | $750 |
| Insurance | $10,000 × 0.5% | $50 |
| Cost of capital | $10,000 × 8% | $800 |
| Shrinkage | $10,000 × 3% | $300 |
| Aging | $10,000 × 2% | $200 |
| Expected rebranding loss | $10,000 × 10% × (1 − 20%) | $800 |
| Total carrying cost | Sum of the lines above | $3,800 |
| Carrying cost as a share of purchase cost | $3,800 ÷ $20,000 | 19% |
| All-in cost per unit ordered | ($20,000 + $3,800) ÷ 5,000 | $4.76 |
Holding the stock adds $0.76 per unit, taking a $4.00 landed unit to $4.76. Of the $3,800, $2,150 comes from the five rate-based lines, which together equal 21.5% of average inventory value, and $1,650 from storage and handling. The rebranding line alone is $800, the same size as the cost of capital, and it is the line most budgets never see.

Rebrand Risk Sensitivity
The probability of a rebrand is the least certain input, so test a range. The table below holds every other input from the example constant and changes only the probability that the remaining stock becomes unusable, with 20% salvage.
| Probability of rebrand in the holding period | Expected rebranding loss | Total carrying cost | Carrying cost as a share of purchase | All-in cost per unit |
| 0% | $0 | $3,000 | 15% | $4.60 |
| 5% | $400 | $3,400 | 17% | $4.68 |
| 10% | $800 | $3,800 | 19% | $4.76 |
| 20% | $1,600 | $4,600 | 23% | $4.92 |
| 30% | $2,400 | $5,400 | 27% | $5.08 |
Even with no chance of a rebrand, carrying cost is $3,000, or 15% of purchase cost. Each additional 10 points of rebrand probability adds $800, which is why a confirmed brand refresh date inside the holding period should change the order size.

One Large Order or Two Smaller Ones
Carrying cost is the reason a smaller order can beat a bigger one that has the lower unit price. The table compares one 5,000-unit order at $4.00 landed against two 2,500-unit orders six months apart at $4.35 landed, a higher price because each smaller order loses part of the price break. All other inputs follow the worked example.
| Line | One 5,000-unit order | Two 2,500-unit orders |
| Landed unit price | $4.00 | $4.35 |
| Purchase cost | $20,000 | $21,750 |
| Average units held | 2,500 | 1,250 |
| Average inventory value | $10,000 | $5,438 |
| Storage | $900 | $450 |
| Handling | $750 | $750 |
| Rate-based lines (21.5% of average value) | $2,150 | $1,169 |
| Total carrying cost | $3,800 | $2,369 |
| Total cost | $23,800 | $24,119 |
| All-in cost per unit | $4.76 | $4.82 |
At a $0.35 price premium, the single large order still wins by about $0.06 per unit. The break-even sits at a landed price of about $4.29 for the smaller orders, a premium of about 7%. If the supplier will quote the smaller orders at or below that, splitting wins, and a higher rebrand probability or storage rate moves the break-even further in its favor.

Aging and Rebranding Risk by Product Type
Aging and rebranding risk differ by product, so set the rates per product rather than for the whole program. The table below gives starting questions, not rates.
| Product type | Aging risk to consider | Rebranding risk to consider | What to check |
| Apparel and textiles | Fading, creasing, and size availability over time | Logos and brand colors that may change | Storage conditions and whether blanks can be held undecorated |
| Hard goods such as drinkware | Generally low, though packaging can deteriorate | Logos and campaign messages that may change | Packaging condition and the brand roadmap |
| Printed materials and notebooks | Paper yellowing and curling in poor storage | Dated content and outdated messaging | Humidity control and whether dates are printed |
| Technology accessories | Components and finishes that may degrade with age | Models and standards that may be superseded | Product guidance on storage life |
| Dated event or campaign items | Low | High, because the date or campaign ends | Event date and any reuse option |
Risks and Limitations of This Model
- The rates in this guide are illustrative inputs, not benchmarks; your own storage quotes, stock counts, and finance assumptions should replace every one of them.
- Probabilities for aging and rebranding are estimates, so show a range and run the sensitivity instead of relying on one number.
- The model assumes an even pace of use; uneven usage changes the average inventory held and the cost.
- Storage providers often apply minimum charges and fixed fees that make small holdings cost more per carton than the example suggests.
- Salvage recovery from reuse or donation is uncertain, so treat the salvage assumption cautiously.
- This model is scoped to general promotional merchandise in US and UK markets, and the worked example is illustrative.
Request a Scoped Quote
If you are deciding how much to order, share your quantity, usage calendar, brand refresh dates, and storage options. Our team can help you request itemized quotes at more than one order size so carrying cost can be compared fairly.
Prefer a lighter first step? Send us your planned quantity and holding period for a quick carrying cost review before you order.
Frequently Asked Questions
What promotional merchandise inventory carrying cost rate should we use?
There is no universal rate to borrow. Calculate your promotional merchandise inventory carrying cost from your own inputs, including storage and handling quotes, your finance team’s cost of capital, and your history of shrinkage, aging, and write-offs. Treat any rate quoted without a source with caution when planning your procurement budget.
Should shrinkage and aging be separate lines?
Yes. Shrinkage covers units that are lost, damaged, or unaccounted for, while aging covers units that become less usable simply because they have been held. They have different causes and different fixes, such as better counts for shrinkage and shorter holding periods for aging. Track both separately to understand their impact on inventory costs and price trade-offs.
How do we estimate the probability of a rebrand?
Start with the brand roadmap, ask the brand team about planned refresh dates, and review how often branding has changed in the past. Use a range, such as low, expected, and high, and run the sensitivity table rather than committing to a single figure. This helps you assess rebranding risk when calculating promotional merchandise inventory carrying cost.
Is it ever worth holding extra stock?
Yes, when the savings from a lower unit price are greater than the carrying cost of the surplus. The break-even calculation in this guide helps you evaluate these price trade-offs, and our price break analysis guide applies the same approach to a supplier’s quoted tiers. Consider both costs before committing more of your procurement budget to inventory.
Does carrying cost belong inside landed cost?
They are different stages. Landed cost covers getting goods to your dock, while carrying cost covers holding them afterwards. Include both in your procurement budget as separate lines so each can be reviewed and improved. This distinction helps you understand the full cost of purchasing and storing promotional merchandise.
Sources and Further Guidance
International Chamber of Commerce — Incoterms® Rules
US International Trade Commission — Harmonized Tariff Schedule (HTS) search
UK Government — Trade Tariff: look up commodity codes, duty and VAT rates
Author & Reviewer
Written by Claire Morgan, Senior Content Writer, with professional experience modeling inventory and holding costs for promotional programs.
Freshness & Update Log
- Published: October 15, 2026
- Last Reviewed: October 15, 2026
- Next scheduled review: within 12 months, or sooner if cited tariff or freight guidance changes materially.
Related Resources
- /promotional-products-budget-allocation/ — how to decide which portfolio tier a price-break decision should apply to.
- /questions-to-ask-a-promotional-product-supplier/ — 18 evidence-based questions to ask once quotes are in hand.
- /promotional-product-supplier-audit-checklist/ — the 25-point checklist for auditing a supplier before you award the order.
- /promotional-merchandise-vendor-consolidation/ — how vendor consolidation interacts with ongoing performance scoring.