
Reading a promotional product price break analysis means comparing the savings on the units you actually need against the real cost of the surplus units required to reach the next tier, including holding cost and the risk that surplus becomes obsolete before you use it. A lower unit price at a higher quantity is only a genuine saving if the extra units get used; otherwise the “discount” is paid for inventory that sits in storage or gets written off.
This guide is written for marketing procurement leads comparing a supplier’s price-break schedule against a known order quantity for US and UK programs. It assumes you have a firm quantity requirement and a price-break table showing at least one tier above it.
Budget scrutiny makes this a current priority: a price break that looks like free savings on a supplier’s quote can quietly become the most expensive decision on the order once unused surplus is accounted for. The sections below provide a decision table for what to verify before jumping a tier, a formula for calculating whether the next tier is actually worth it, a buyer framework, and an illustrative worked example with a breakeven calculation.

Why a Price Break Table Isn’t a Simple “Buy More, Save More” Decision
A supplier’s price-break schedule is designed to look like an easy upgrade: order a bit more, and the unit price drops. For the quantity you actually need, that lower price is a real saving. For the extra units required to reach the tier, it is a bet — a bet that you will use them before they become irrelevant, and a bet made without counting what it costs to hold them in the meantime.
A promotional product price break analysis separates those two things. It prices the units you need at the better rate, then prices the surplus honestly, including the chance it never gets used and what it costs to store in case it does.
Decision Table: What to Verify Before Jumping a Price Tier
Use the table below to check what you actually know, versus what you’re assuming, before ordering up to a higher quantity tier.
| Criterion | What to verify | Why it matters | Evidence to request |
| Price differential | The per-unit price drop at the next quantity tier | Determines how much is actually saved on the units you need | The full price-break schedule in writing, not just the next tier |
| Surplus quantity | How many extra units the next tier requires | Determines your exposure if the surplus goes unused | The exact next-tier minimum, not a rounded estimate |
| Probability of use | How likely the surplus is to be used before a rebrand, event, or program change | Determines whether the lower price is a real saving or a sunk cost | Your own program calendar and prior reorder history |
| Holding cost | Storage, handling, and insurance cost for carrying surplus inventory | Adds to the true cost of the surplus beyond the purchase price | An internal storage cost estimate, even a rough one |
| Obsolescence trigger | Any known date, event, or brand change that would make the surplus unusable | Converts a soft “might not use it” into a hard deadline | A documented date for the relevant trigger, if one exists |
| Resale or donation value | Whether unused surplus has any recovery value | Partially offsets the cost of unused surplus | A realistic estimate, not a hopeful one |
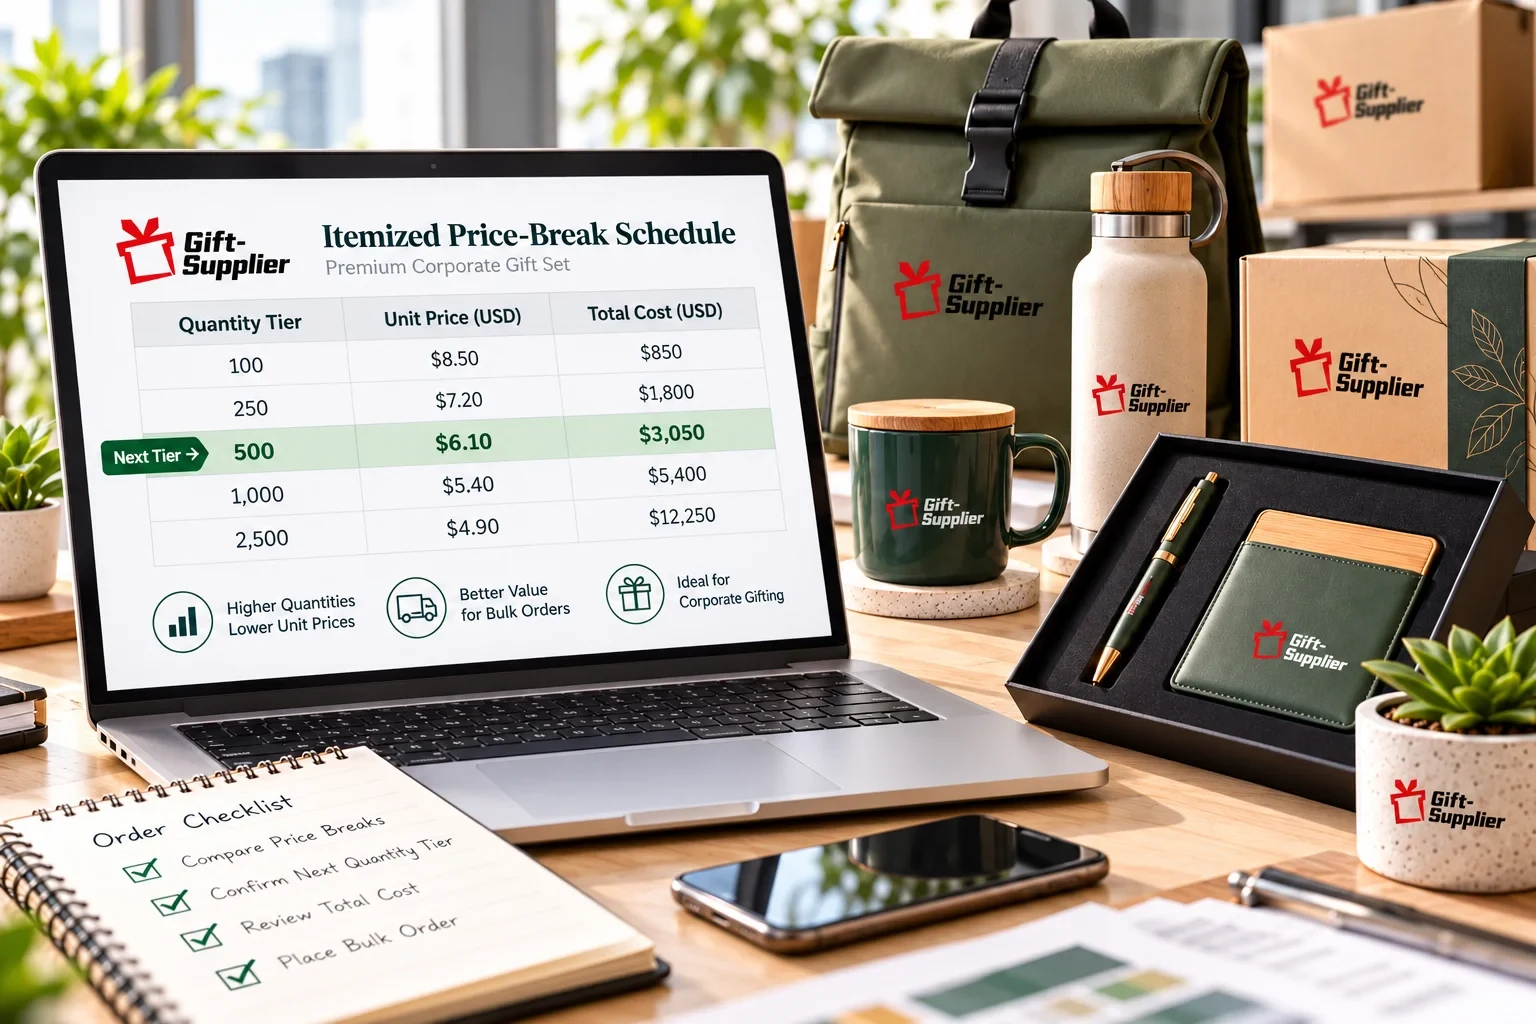
The Price Break Value Formula: Is the Next Tier Worth It?
The formula compares the effective cost per usable unit of staying at your needed quantity against moving up to the next tier, once surplus risk and holding cost are included.
| Effective cost per usable unit = (Total cost of the order + Holding cost of any surplus) ÷ Expected usable units, where expected usable units for any surplus = Surplus quantity × Probability of use |
Calculate this once for your needed quantity at the current tier, and once for the next tier’s quantity at its lower price. Whichever option has the lower effective cost per usable unit is the better deal.
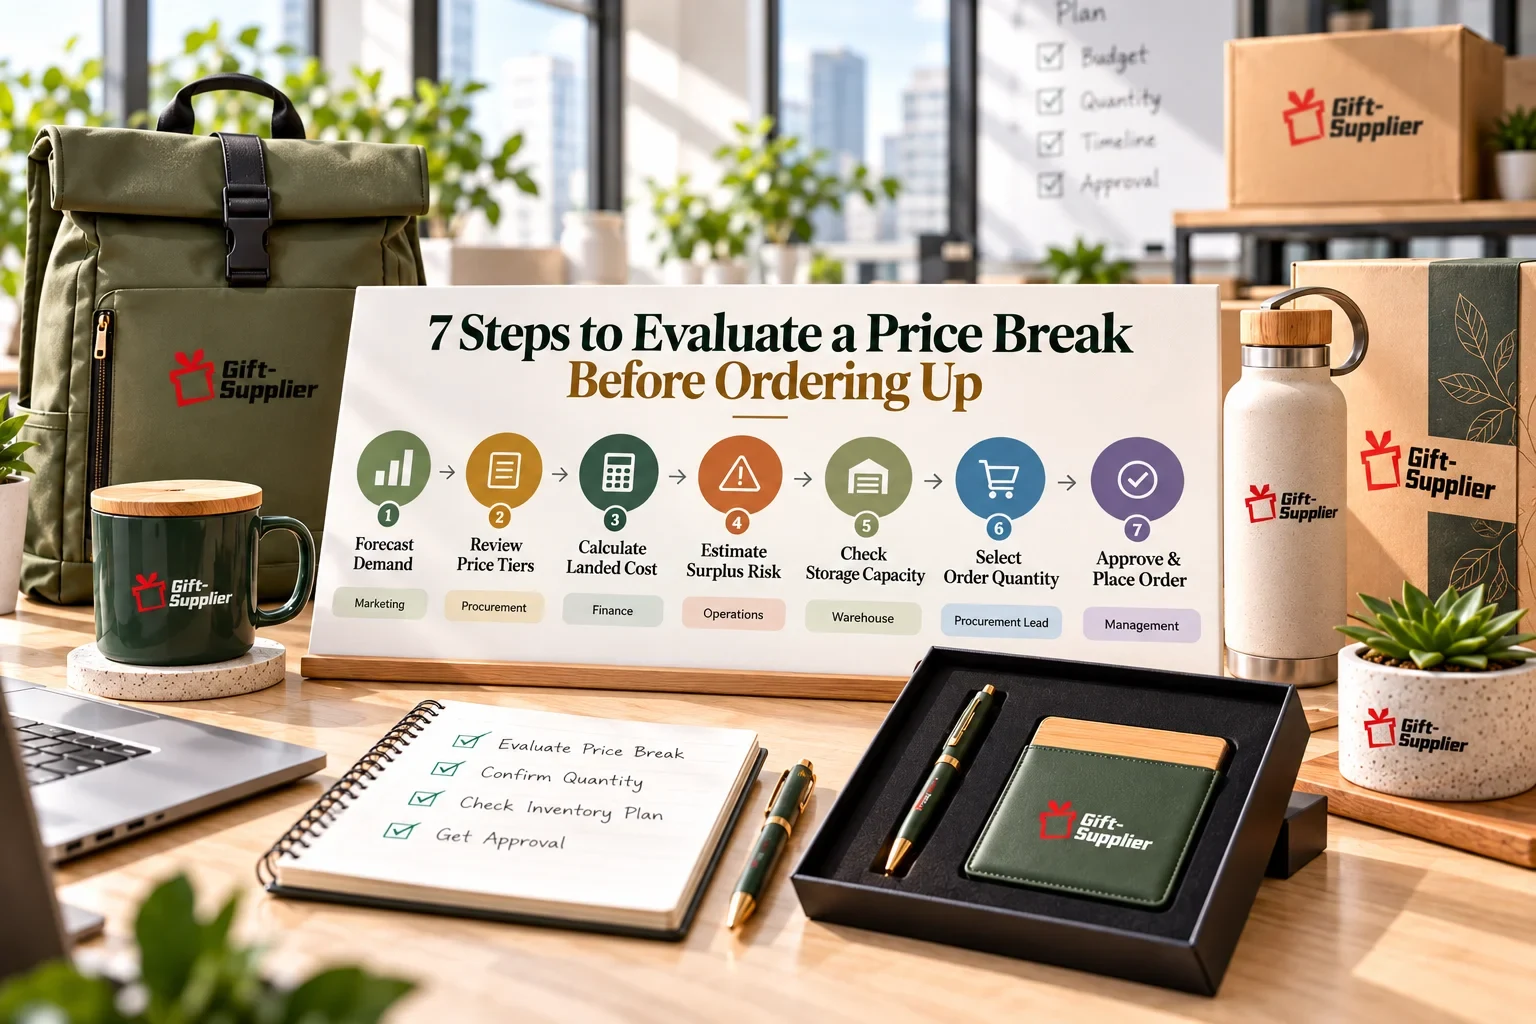
Buyer Framework: How to Evaluate a Price Break Before Ordering Up
The steps below turn the formula into a repeatable process. The decision owner is typically the marketing procurement lead, with finance or operations supplying the holding-cost estimate.
- Get the full price-break schedule from the supplier in writing, not just the price at your target quantity.
- Calculate the price differential and surplus quantity between your needed quantity and the next tier.
- Estimate a realistic probability that the surplus will be used before an obsolescence trigger — a rebrand, event date, or program change.
- Estimate holding cost for carrying the surplus, even roughly, using your own storage or handling costs.
- Calculate effective cost per usable unit for both options using the formula above, and compare them directly.
- Find the breakeven probability — the usage rate at which moving up stops being worth it — and compare it to your honest estimate.
- Document the decision and the assumptions behind it, dated, so it can be revisited at the next reorder.
Evidence From the Field: Illustrative Price Break Analysis
A marketing procurement lead needs 500 units of a branded item. The supplier’s price-break schedule offers 500 units at $5.00 each, or 1,000 units at $4.20 each. The lead estimates a 40% chance the extra 500 units would be used before the item is retired for a planned rebrand, and estimates holding cost at $250 for the surplus over that period.
| Element | Stay at 500 units | Move up to 1,000 units |
| Order quantity | 500 | 1,000 |
| Unit price | $5.00 | $4.20 |
| Order cost | $2,500 | $4,200 |
| Holding cost | $0 | $250 |
| Total cost | $2,500 | $4,450 |
| Surplus units | 0 | 500 |
| Probability of use (illustrative) | not applicable | 40% |
| Expected usable units | 500 | 700 |
| Effective cost per usable unit | $5.00 | $6.36 |
At a 40% chance of using the surplus, moving up to 1,000 units costs $6.36 per usable unit, more than the $5.00 paid by simply ordering the 500 units needed. The lower unit price on the quote did not translate into a lower real cost, because the surplus carried too much obsolescence risk.

Breakeven Sensitivity: How Probability of Use Changes the Answer
The table below holds the next tier’s total cost at $4,450 and varies only the probability that the surplus 500 units get used, to find the point where moving up actually pays off.
| Probability surplus is used | Expected usable units | Effective cost per usable unit |
| 0% | 500 | $8.90 |
| 25% | 625 | $7.12 |
| 50% | 750 | $5.93 |
| 78% (breakeven) | 890 | $5.00 |
| 100% | 1,000 | $4.45 |
In this illustrative case, the supplier’s quote would need to be used with roughly 78% confidence before the higher quantity actually pays off. An honest estimate of 40% falls well short of that bar, which is the kind of gap a price-break schedule alone will never show.
Obsolescence Risk by Product Type
Obsolescence risk is not the same across every program. Use the table below to gauge how cautious to be before accepting surplus from a price break.
| Program or product type | Obsolescence risk | Why |
| Dated event merchandise | High | Surplus is unusable once the specific event date has passed |
| Co-branded or partner merchandise | High | Surplus is unusable if the partnership or co-branding changes |
| Core evergreen branded item | Low | Surplus can typically be used in a future, unrelated program |
| Seasonal or trend-linked item | Moderate to high | Surplus loses relevance once the season or trend passes |
| New-hire or onboarding kit item | Low to moderate | Usage is ongoing but tied to hiring pace, which can shift |
When Not to Chase the Next Tier
| Situation | Why the next tier is usually a poor fit |
| A known obsolescence trigger falls before the surplus could realistically be used | The surplus has a near-zero probability of use regardless of how low the price looks |
| Holding cost has never been estimated and storage space is already tight | The true cost of the surplus is likely higher than assumed, not lower |
| The program is new, with no usage history to estimate probability of use | A confident probability estimate isn’t yet possible, so the breakeven comparison is unreliable |
| The price differential between tiers is small relative to the surplus quantity | A small per-unit saving rarely clears the breakeven bar once surplus risk is included |
Risks and Limitations of This Price Break Analysis
- Probability-of-use estimates are a judgment call; a consistently overoptimistic estimate will make every price break look like a better deal than it actually is.
- Holding cost is often underestimated when it isn’t formally tracked; a rough estimate is more reliable than assuming it’s zero.
- This framework assumes the price-break schedule is accurate and stable; confirm it hasn’t changed since the quote was issued before ordering.
- Some surplus has genuine salvage value through donation or a future, unrelated program; don’t assume unused inventory is a total loss without checking.
- The breakeven calculation is sensitive to the holding-cost estimate; a significant change in that input meaningfully shifts the breakeven probability.
- The worked example in this guide is illustrative; actual price breaks, surplus risk, and holding costs will vary by supplier, product, and program.
Request a Scoped Quote
If you are weighing a supplier’s price break against your actual needs, share your target quantity, program timeline, and any known obsolescence triggers. Our team can help you request a full price-break schedule and evaluate it properly.
Prefer a lighter first step? Send us your supplier’s price-break schedule for a quick breakeven review before you order up a tier.
Frequently Asked Questions
Is it ever worth buying up to the next tier with no clear use for the surplus?
Generally no, unless the surplus has real salvage value — such as a donation outlet, a future unrelated program, or genuine resale potential. Without that, surplus with no planned use is simply inventory cost with no offsetting benefit, regardless of how attractive the unit price looks. In a promotional product price break analysis, this is an important price trade-offs consideration for protecting the procurement budget.
How do I estimate holding cost if we don’t track it formally?
A rough estimate — storage space cost, handling time, and a reasonable risk of damage or loss over the holding period — is more useful than treating holding cost as zero. Even an approximate figure can meaningfully change the breakeven calculation and the landed cost of the surplus, as shown in the sensitivity table above.
Does this apply to price breaks on compliance-sensitive products?
Yes, and the stakes are higher. Surplus of a product with compliance documentation tied to a specific configuration or market can become unusable, or require re-verification, if requirements change before the surplus is used. This risk should be included in the promotional product price break analysis and procurement budget.
What if the supplier won’t share the full price-break schedule?
Request it in writing before committing to any quantity. A supplier unwilling to share the full schedule makes it impossible to run this analysis properly, which is itself useful information when evaluating price trade-offs and planning the procurement budget.
How does this relate to total cost of ownership?
This analysis focuses specifically on surplus and obsolescence risk at a given price tier. For the fuller calculation — including tooling, freight, duties, rejects, and landed cost — total cost of ownership provides the broader view.
Sources and Further Guidance
International Chamber of Commerce — Incoterms® Rules
US International Trade Commission — Harmonized Tariff Schedule (HTS) search
UK Government — Trade Tariff: look up commodity codes, duty and VAT rates
US Consumer Product Safety Commission — Children’s Product Certificate
Author & Reviewer
Written by Claire Morgan, Senior Content Writer, with professional experience evaluating price-break schedules and inventory risk for branded merchandise programs.
Freshness & Update Log
- Published: October 2, 2026
- Last Reviewed: October 2, 2026
- Next scheduled review: within 12 months, or sooner if referenced freight or duty guidance changes materially.
Related Resources
- /promotional-products-budget-allocation/ — how to decide which portfolio tier a price-break decision should apply to.
- /questions-to-ask-a-promotional-product-supplier/ — 18 evidence-based questions to ask once quotes are in hand.
- /promotional-product-supplier-audit-checklist/ — the 25-point checklist for auditing a supplier before you award the order.
- /promotional-merchandise-vendor-consolidation/ — how vendor consolidation interacts with ongoing performance scoring.