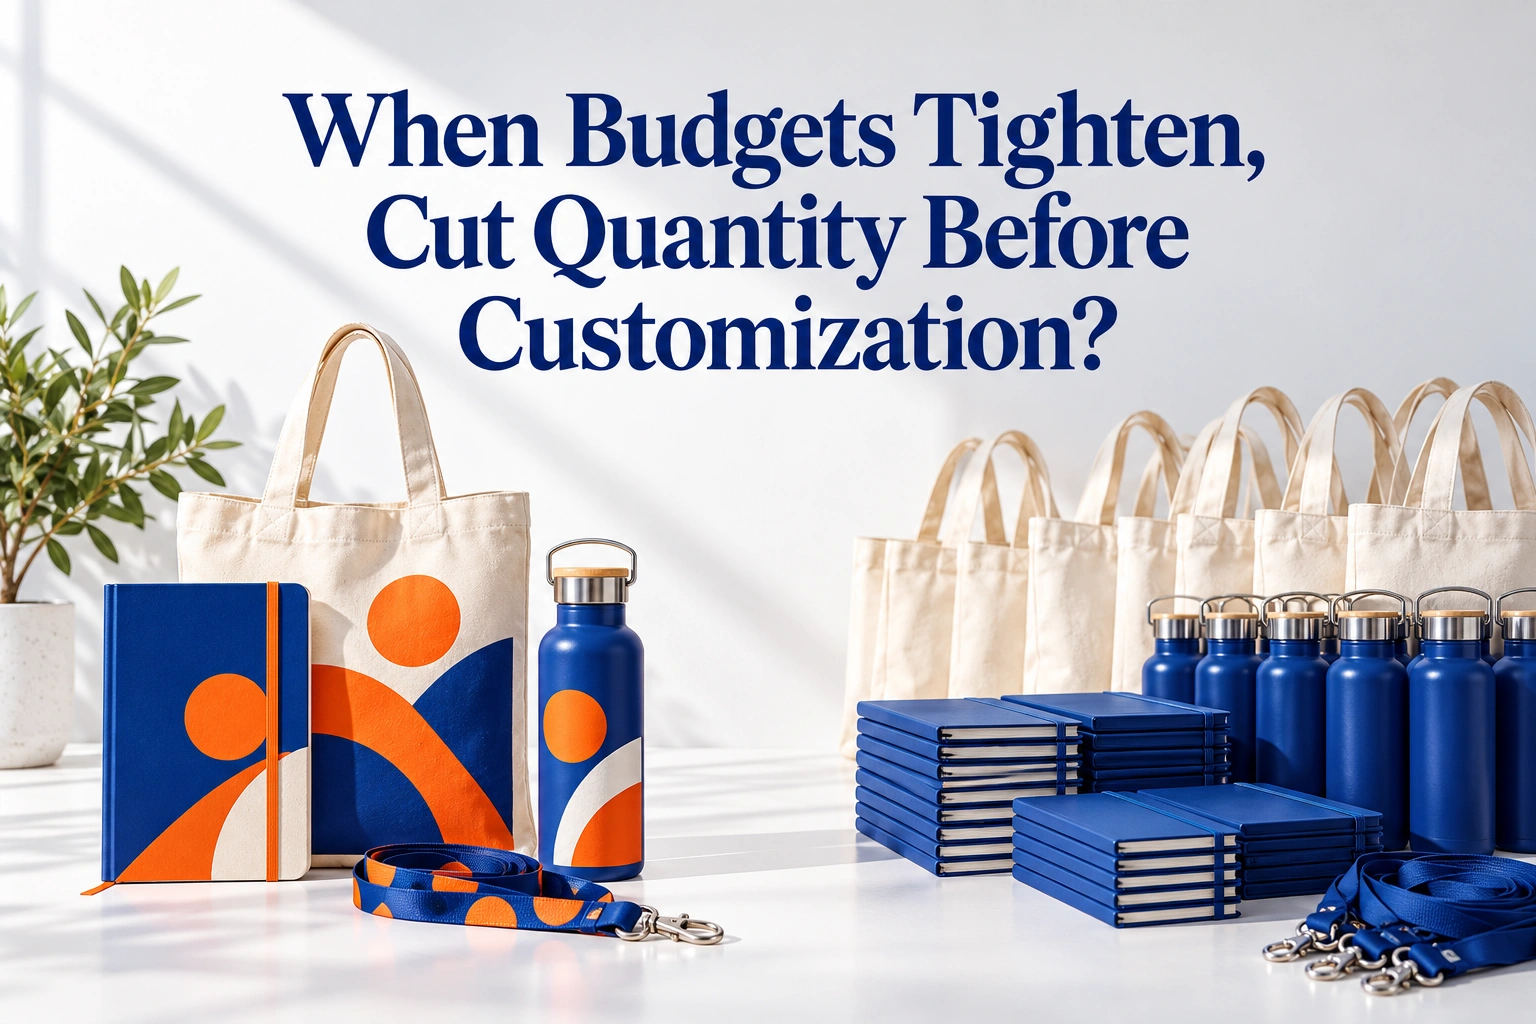
Cut quantity before customization only when customization is what makes each gift relevant and its fixed setup cost is small relative to the budget; otherwise, simplify the customization first. The deciding number is breakeven uplift: how much more valuable a customized gift must be per recipient for fewer customized gifts to match the value of more plain ones. In the illustrative example below, that bar is about 27%. This guide is written for marketing procurement leads applying a promotional product budget cuts strategy in US and UK markets, with itemized quotes and some history of how customized and standard gifts have performed. Assumptions are dated October 14, 2026.
Budget scrutiny makes this a current priority, and the instinct to trim the visible extras first often cuts the wrong thing. Customization is mostly a fixed cost, while quantity is mostly a variable one, so each cut moves the cost per unit in a different direction. The sections below provide a decision table, a breakeven formula, a buyer framework with a named decision owner, an illustrative worked example with sensitivity tests, and an honest look at what evidence exists for a shift toward smaller, better-targeted runs.
Why “Cut Quantity or Cut Customization” Is the Wrong First Question
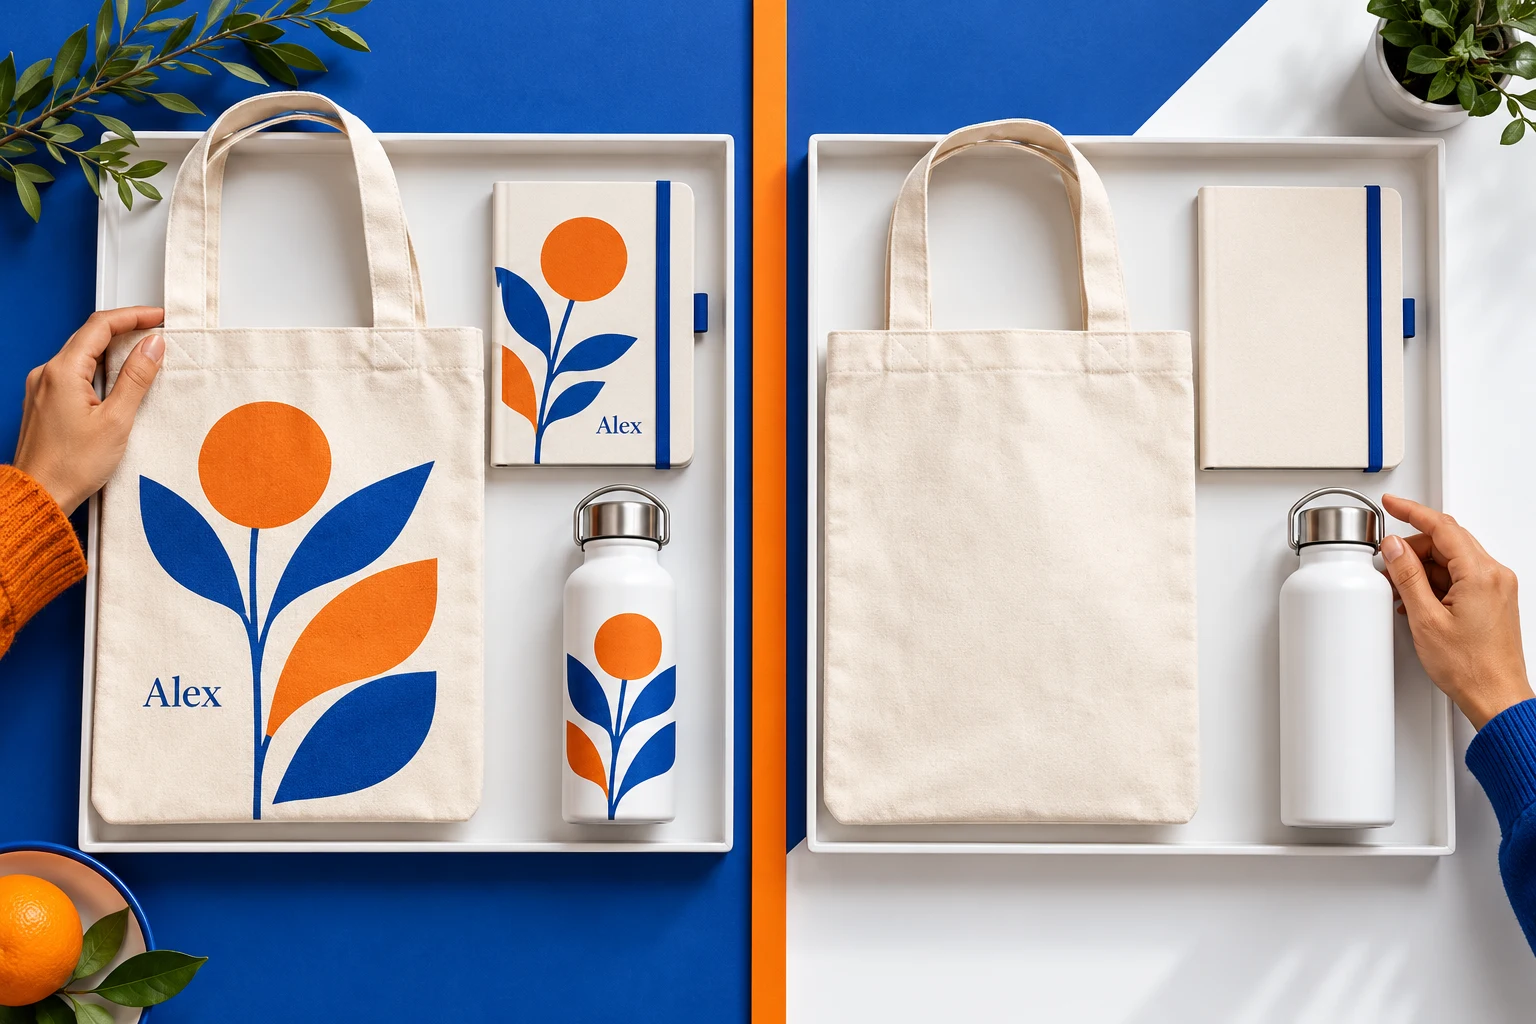
Both cuts save money, but they save it differently. Customization usually carries a one-time setup charge for artwork, screens, proofs, or personalization data, which is spread across however many units you order. Quantity drives the variable cost: production, freight, and handling per unit. Cutting units removes variable cost but leaves the fixed setup in place, so the cost per unit rises. Cutting customization removes the fixed cost and often lowers the unit price, but it changes what the recipient receives.
The better first question is what each recipient is worth with and without customization. A promotional product budget cuts strategy that ignores that value compares costs only, and the cheapest plan on paper can deliver the least. The rest of this guide turns the question into a number you can test.
Decision Table: Cutting Quantity vs. Cutting Customization
Use the table below to compare the two cuts against criteria you can verify on your own quotes.
| Criterion | Cut quantity, keep customization | Cut customization, keep quantity | What to verify |
| Effect on cost per unit | Rises, because fixed setup is spread over fewer units | Falls, because setup is removed and decoration is simpler | Itemized setup and unit price at each quantity |
| MOQ and price breaks | Fewer units may fall below a price-break tier or the supplier’s MOQ | Quantity stays at the same tier | Price-break schedule and MOQ in writing |
| Lead time | Customization proofing still applies | Fewer proofing rounds, so scheduling is often simpler | Lead time at your quantity, including proofing |
| Material and finish | Unchanged | May change if the decoration method changes | A physical sample of the simplified version |
| Recipient relevance | Higher per recipient, but fewer recipients reached | Lower per recipient, but more recipients reached | Your own results for customized versus standard gifts |
| Inventory exposure | Lower, because fewer units are held | Same as the original plan | Realistic usage against the quantity ordered |
| Reversibility next run | Easy to scale back up if the setup can be reused | Customization may need new setup later | Whether setup and artwork can be reused on reorder |

The Breakeven Uplift Formula
Set a target budget, then work out how many units each option can buy. Option A keeps customization and cuts quantity. Option B drops customization and keeps as many units as the budget allows.
| Units under A = (Target budget − Customization setup) ÷ Variable cost per customized unit. Units under B = Target budget ÷ Variable cost per plain unit. Breakeven uplift = (Units under B ÷ Units under A) − 1 |
Breakeven uplift is the minimum increase in value per recipient that customization must deliver for Option A to match Option B. Measure value in whatever you already track, such as response rate, meetings booked, or redemption. If your own data shows a larger uplift than the breakeven, cutting quantity is the better choice; if not, simplify the customization.
Buyer Framework: How to Decide Where to Cut
The steps below turn the formula into a repeatable process. The decision owner is typically the marketing procurement lead, with the campaign or sales owner supplying the performance data used to judge customization value.
- Set the target budget and the size of the cut, and list the original plan’s units, setup, and variable costs from itemized quotes.
- Request quotes for the simplified version, including any change in unit price, MOQ, or price-break tier at the lower quantity.
- Calculate units, cost per unit, and landed cost for Option A and Option B using the formula above.
- Work out the breakeven uplift for each option, including a version of Option A with a price-break penalty.
- Compare the breakeven with your own history of customized versus standard gifts, and with a small holdout test if no history exists.
- Test the answer against the setup-cost sensitivity below, since the fixed cost of customization is the main driver.
- Record the decision, the assumptions, and the dates, so the choice can be reviewed at the next program.
Evidence From the Field: Illustrative Worked Example
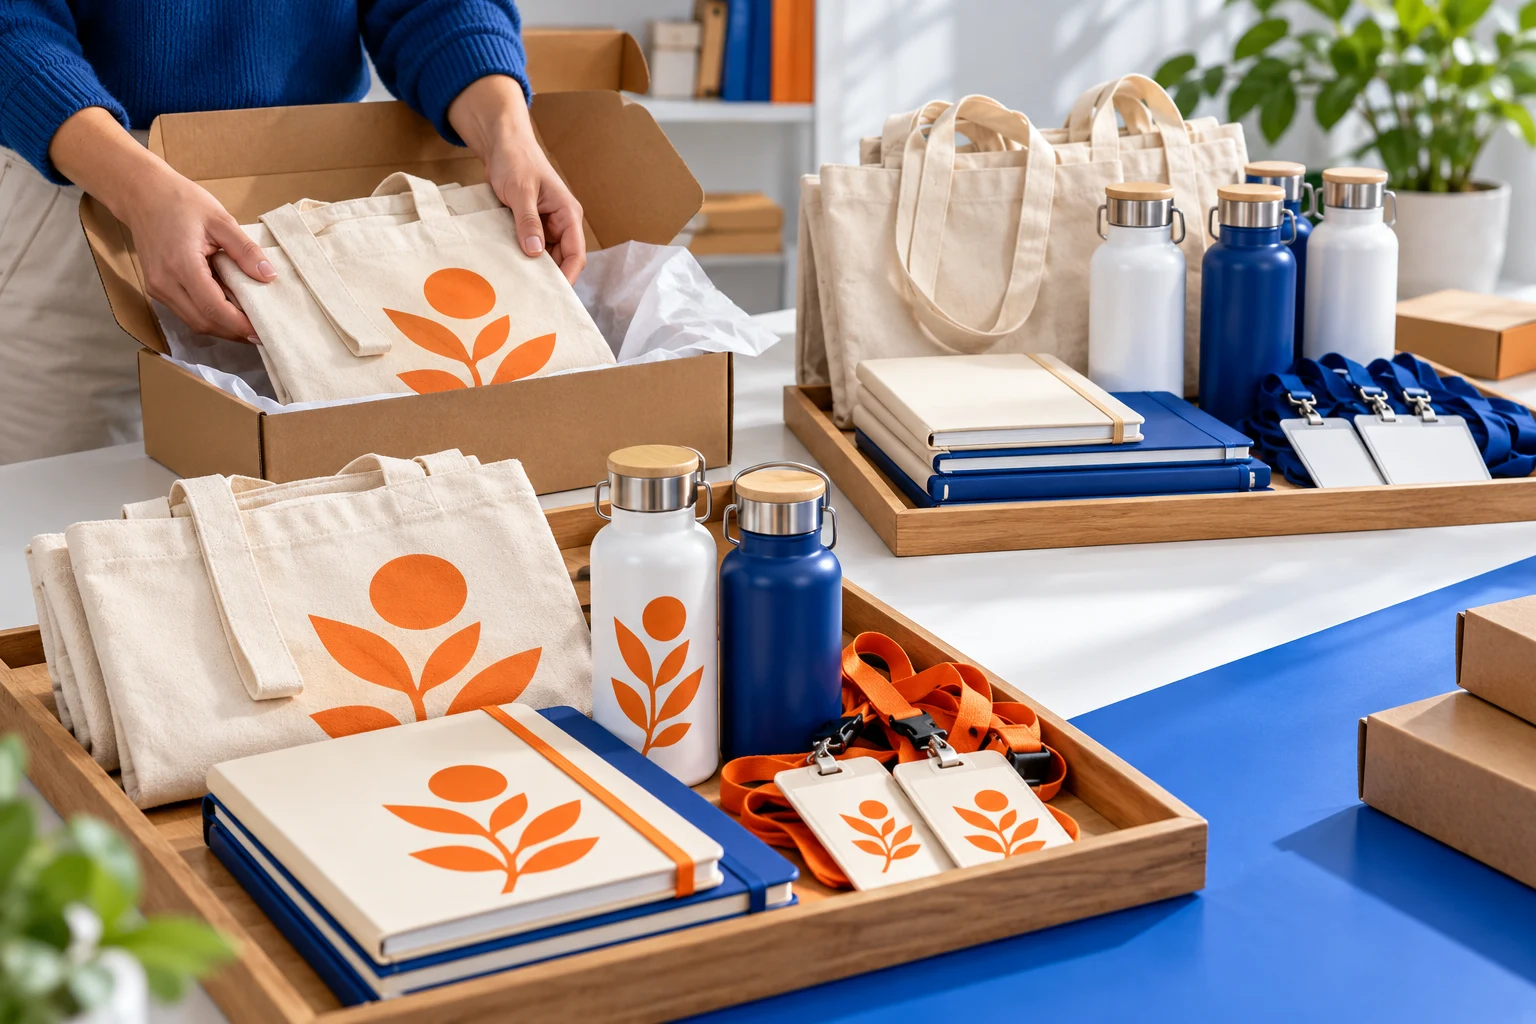
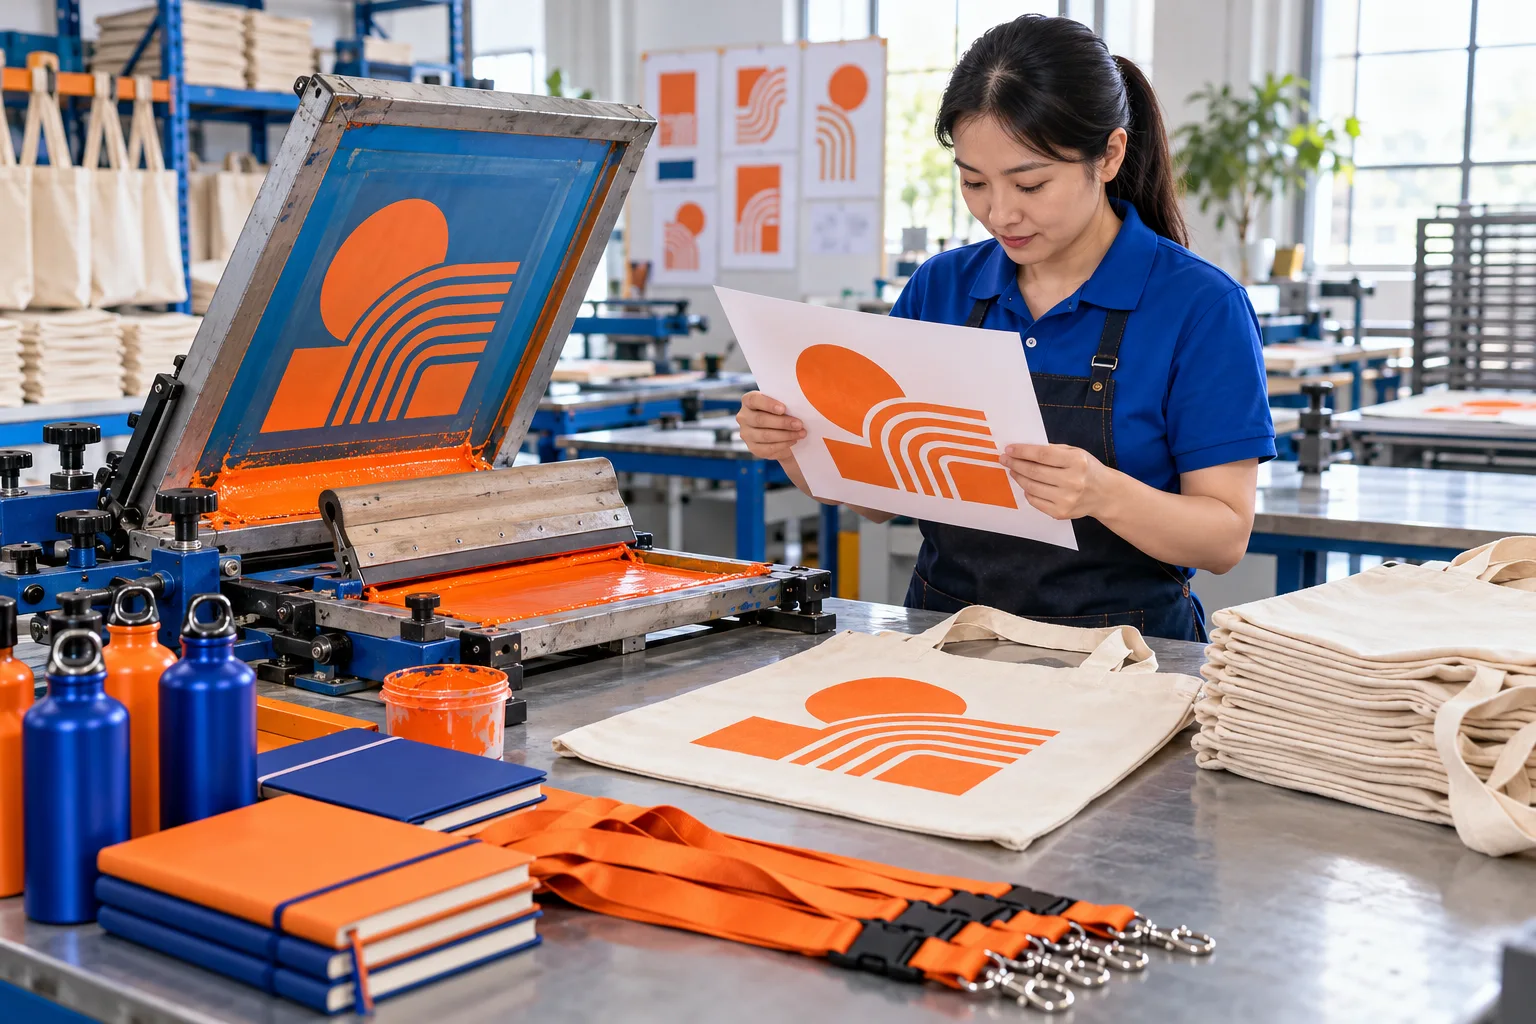
A marketing procurement lead plans 1,000 customized gifts at a total of $5,600 and must cut the budget by 25% to $4,200. The customized item costs $4.20 to produce plus $0.80 for freight and handling per unit, with a $600 one-time customization setup. A standard version costs $3.80 to produce plus the same $0.80, with no setup. In the penalty column, an illustrative price-break loss adds $0.30 per unit below 1,000 units.

| Line | Baseline: 1,000 customized | Option A: cut quantity | Option A with price-break penalty | Option B: cut customization |
| Units | 1,000 | 720 | 679 | 913 |
| Variable cost per unit | $5.00 | $5.00 | $5.30 | $4.60 |
| Customization setup (one-time) | $600 | $600 | $600 | $0 |
| Total cost | $5,600 | $4,200 | $4,199 (rounded) | $4,200 (rounded) |
| Cost per unit | $5.60 | $5.83 | $6.18 | $4.60 |
| Customized | Yes | Yes | Yes | No |
| Breakeven uplift versus Option B | Not applicable | 27% | 34% | Not applicable |
Option A buys 193 fewer gifts than Option B (720 against 913), and each carries a cost per unit of $5.83 against $4.60. It pays off only if a customized gift is at least about 27% more valuable per recipient, or about 34% if a price-break penalty applies. Without evidence of an uplift that large, Option B reaches more recipients for the same money.
Sensitivity: How Much Does Customization Need to Deliver?
The first table sets plain-gift value per recipient at 1.00 and varies the uplift that customization delivers. Value index is units multiplied by value per recipient.
| Uplift in value per recipient from customization | Option A value index (720 units) | Option B value index (913 units) | Option A compared with Option B |
| 0% | 720 | 913 | 21.1% lower |
| 10% | 792 | 913 | 13.3% lower |
| 27% | 914 | 913 | About equal |
| 40% | 1,008 | 913 | 10.4% higher |
| 60% | 1,152 | 913 | 26.2% higher |
The second table varies the one-time setup cost, holding everything else constant. Option B has no setup, so its 913 units do not change.
| Customization setup | Units under Option A | Cost per unit under Option A | Breakeven uplift |
| $200 | 800 | $5.25 | About 14% |
| $600 | 720 | $5.83 | About 27% |
| $1,200 | 600 | $7.00 | About 52% |
The fixed setup cost is the main driver. At a $200 setup, customization needs to lift value per recipient by only about 14% to justify cutting quantity. At $1,200, it needs about 52%, which few programs can show without strong evidence.
Is a Preference for Smaller, Better-Targeted Runs Real?
It is reasonable to ask whether buyers are moving toward smaller, more targeted runs, and the question is worth testing rather than assuming. Trade reporting does describe strong interest in personalization. The Advertising Specialty Institute reported growing interest in personalization-ready products in a December 2025 announcement, and trade coverage of PPAI Expo 2026 listed personalization and experiential marketing among the trends on the show floor. PPAI also publishes an end-buyer study on purchasing behavior, although the detailed data is available to members.
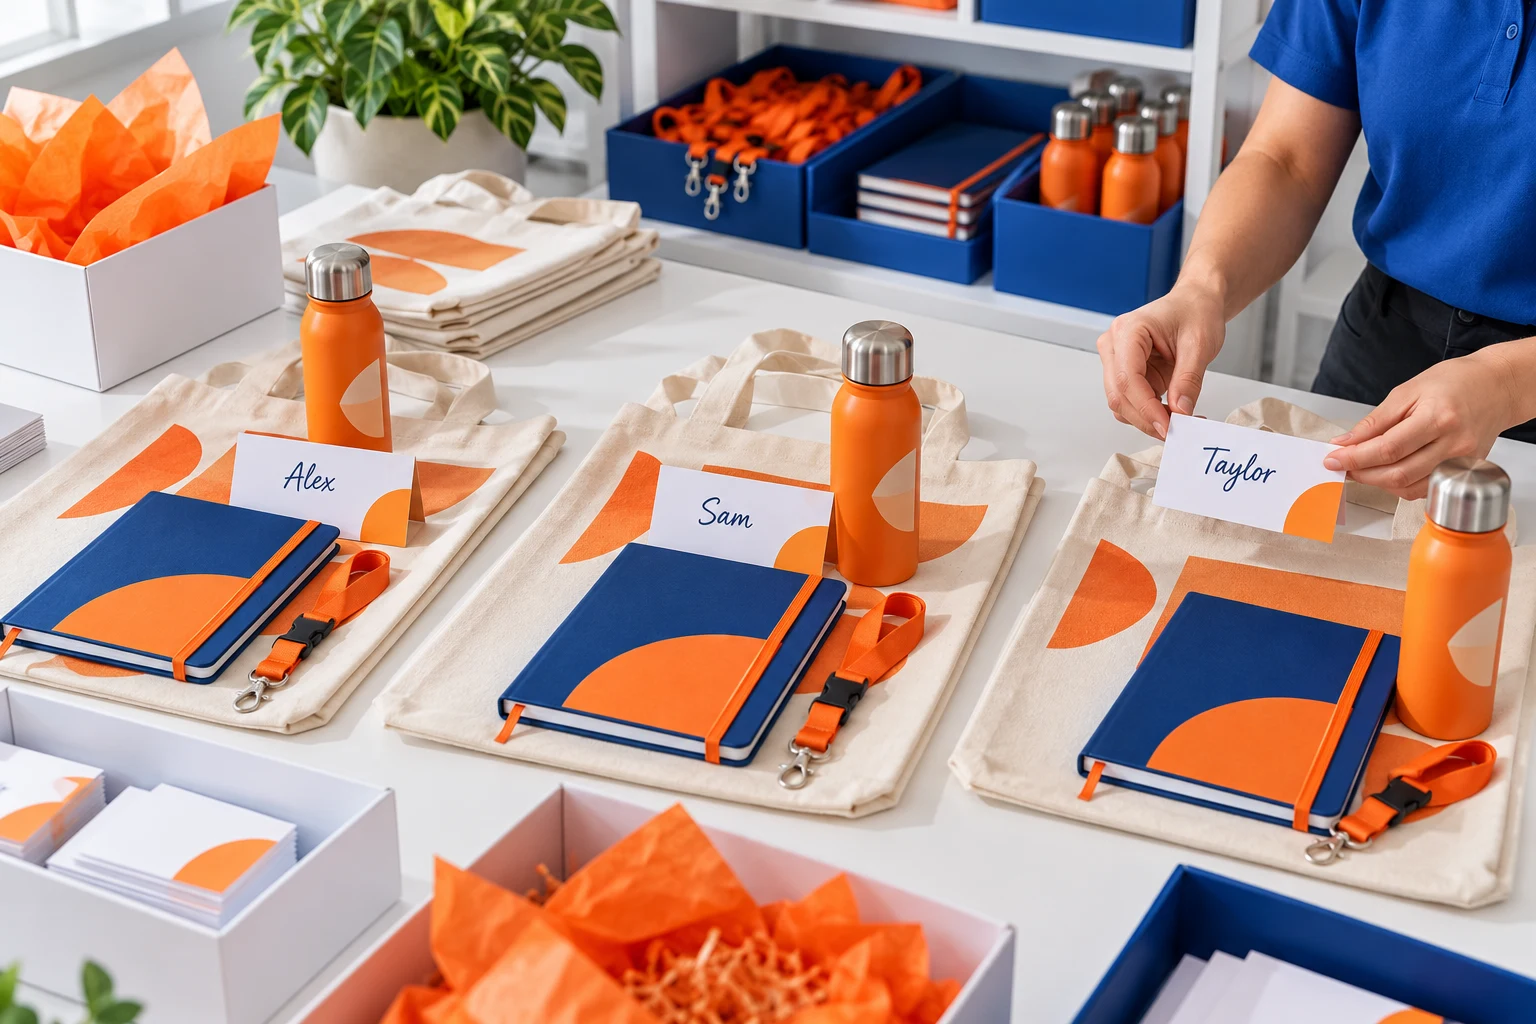
None of the sources I located measures run size, so they speak to demand for personalization, not to a shift toward smaller orders. Treat the preference as a hypothesis for your own program, and test it with the evidence in the table below.
| Evidence source | What it can show | Limitation |
| Your own order history | How customized and standard gifts compare on response, redemption, or follow-up | Past programs may differ in audience, product, and timing |
| CRM or sales follow-up by recipient segment | Which segments respond most to a customized gift | Needs consistent tagging of who received what |
| A holdout within a program | A direct comparison of two versions on matched recipient groups | Needs enough recipients per group to read a difference |
| Trade research on personalization demand | Whether interest in personalized products is growing | Does not measure run size or your own recipients |
| Recipient feedback | How recipients perceived relevance and quality | Self-reported, and subject to response bias |

When Each Cut Tends to Fit
The table below summarizes the situations that tend to favor each cut. Treat it as a starting point and confirm it against your own quotes and results.
| Situation | Lean toward | Why |
| Customization setup is low and you have evidence it lifts response | Cut quantity | The fixed cost is small, and the uplift needed to break even is low |
| Customization setup is high relative to the budget | Cut customization | The fixed cost is spread over too few units, which raises cost per unit sharply |
| The recipient list can be narrowed to the highest-value contacts | Cut quantity | Fewer, better-targeted gifts focus spend where it is most likely to matter |
| The gift is generic and personalization adds little relevance | Cut customization | There is little value for the fixed cost to buy |
| Cutting units drops you below a price-break tier or MOQ | Test both, with a penalty | The penalty raises the uplift customization must deliver |
| You have no data on customized versus standard performance | Run a small holdout first | A holdout is cheaper than a wrong program-wide cut |
Risks and Limitations of This Approach
- Value per recipient is hard to measure; the breakeven is only as reliable as the metric and the test behind it.
- The cost lines in this guide are illustrative assumptions; real price breaks, setup fees, and MOQs vary by supplier and product.
- The sources I located show interest in personalization, not a measured shift toward smaller runs, so the preference should be treated as a hypothesis to test.
- Cutting quantity can trigger MOQ and price-break penalties and freight minimums that raise landed cost.
- Personalization can add proofing rounds and lead time, and may involve sharing recipient data with a supplier, so confirm your data-handling obligations before sending names.
- This model is scoped to general promotional merchandise in US and UK markets; regulated categories and other markets may differ, and the worked example is illustrative.
Request a Scoped Quote
If you need to cut a promotional budget without guessing, share your current quote, target budget, and any results from customized and standard gifts. Our team can help you request itemized quotes for each option so the comparison is fair.
Prefer a lighter first step? Send us your current quote and the revised target for a quick breakeven review before you cut.
Frequently Asked Questions
Should we ever cut both quantity and customization?
Yes, when the cut is deep. In a promotional product budget cuts strategy, start with the change that sacrifices the least value, usually simplifying customization where setup costs are high, then reduce quantity or narrow the product list for the remainder. Evaluate the combined plan to understand the cost per unit, breakeven point, and overall price trade-offs.
How do we measure value per recipient?
Choose one metric you already track, such as response rate, meetings booked, or redemption, and apply it consistently. A small holdout, with two matched groups receiving different versions, gives a cleaner comparison than comparing across different programs. This helps you assess whether your procurement budget is delivering the intended value per recipient.
Can we customize only for a subset of recipients?
Yes. A split plan, with customization for the highest-value contacts and a standard version for the rest, is a common compromise. Quote each version separately, since the setup cost applies only to the customized units. This approach helps manage price trade-offs while keeping your procurement budget focused on priority recipients.
What if our price breaks are steep?
Add a price-break penalty to Option A, as in the illustrative example. A steeper penalty raises the breakeven uplift, which makes cutting customization more attractive. Request the full price-break schedule before deciding, and compare the resulting landed cost and unit economics as part of your promotional product budget cuts strategy.
How does cutting quantity affect landed cost?
Fewer units can raise the landed cost per unit through fixed freight and handling charges, not only through setup. Before reducing quantities, compare the total cost and per-unit impact to understand the price trade-offs and protect your procurement budget. See our promotional product landed cost calculator guide for the full import-side calculation.
Sources and Further Guidance
PPAI — PPAI Research releases 2024 consumer study (end-buyer research overview)
ASI — PPAI Expo 2026: 4 trends from the show floor (trade coverage; may require membership)
International Chamber of Commerce — Incoterms® Rules
US International Trade Commission — Harmonized Tariff Schedule (HTS) search
UK Government — Trade Tariff: look up commodity codes, duty and VAT rates
Author & Reviewer
Written by Claire Morgan, Senior Content Writer, with professional experience modeling cost trade-offs for promotional programs.
Freshness & Update Log
- Published: October 14, 2026
- Last Reviewed: October 14, 2026
- Next scheduled review: within 6 months, or sooner if cited research or trade reporting changes materially.
Related Resources
- /promotional-products-budget-allocation/ — how to decide which portfolio tier a price-break decision should apply to.
- /questions-to-ask-a-promotional-product-supplier/ — 18 evidence-based questions to ask once quotes are in hand.
- /promotional-product-supplier-audit-checklist/ — the 25-point checklist for auditing a supplier before you award the order.
- /promotional-merchandise-vendor-consolidation/ — how vendor consolidation interacts with ongoing performance scoring.